Dec 26, 2025
How to use trade & tonic to turn any stock into a clear Buy, Sell, or Hold decision
trade & tonic turns stock analysis into a clear, guided conversation instead of a messy hunt through charts, ratios, and news feeds. The core question this guide answers is: “How do you use trade & tonic to quickly decide whether any stock is a buy, sell, or hold, and understand why?”
The platform does this by running a multi‑agent AI analyst team on each ticker, covering technicals, fundamentals, news sentiment, macro context, and risk, then compressing everything into one verdict, a confidence score, and a short thesis you can actually read in a minute.
You start by entering a ticker, letting the AI agents run their parallel checks, and reading the main BUY/SELL/HOLD decision plus confidence score. From there, you can drill into the different analysis layers, price action, financial health, recent headlines, and broader market conditions, and see how each agent contributed to the final call. Together, these steps turn scattered market data into one coherent, actionable view you can use with any stock, whether you are researching a new idea or stress‑testing a position you already hold.
Here is a clean, step‑by‑step guide to analyze Nvidia (NVDA).
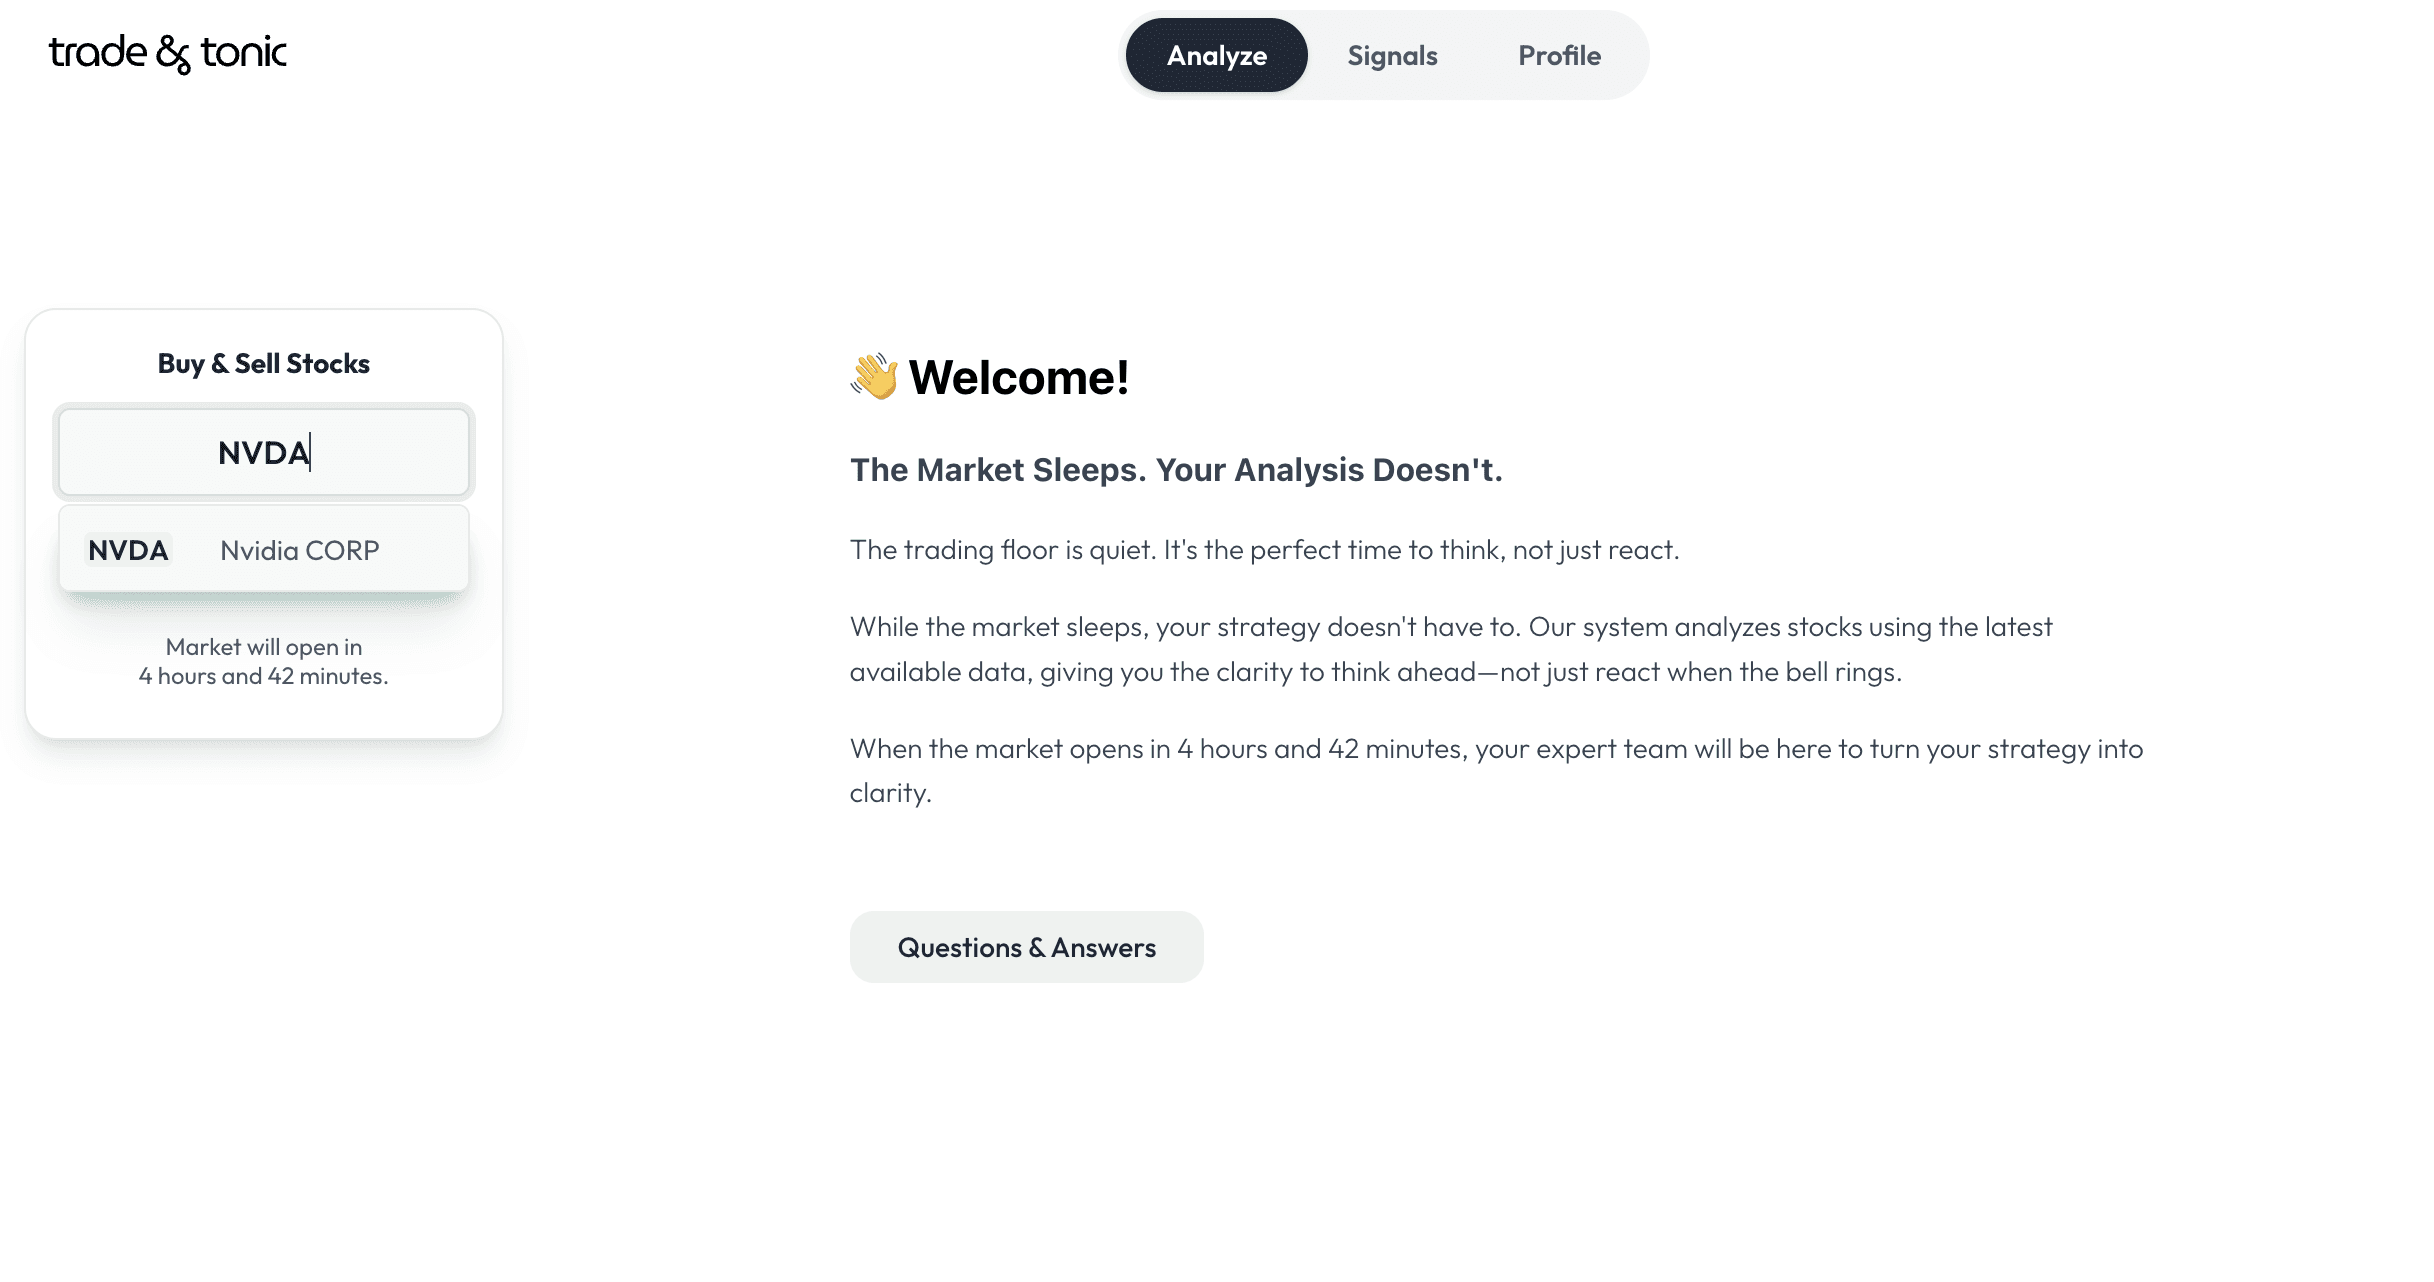
Step 1: Log in to Trade & tonic and enter NVDA
Log in to your trade & tonic dashboard and go to the main analysis screen, where you can type a ticker.
Enter “NVDA” in the search bar and start the analysis; this triggers all AI agents to begin evaluating Nvidia in real time.
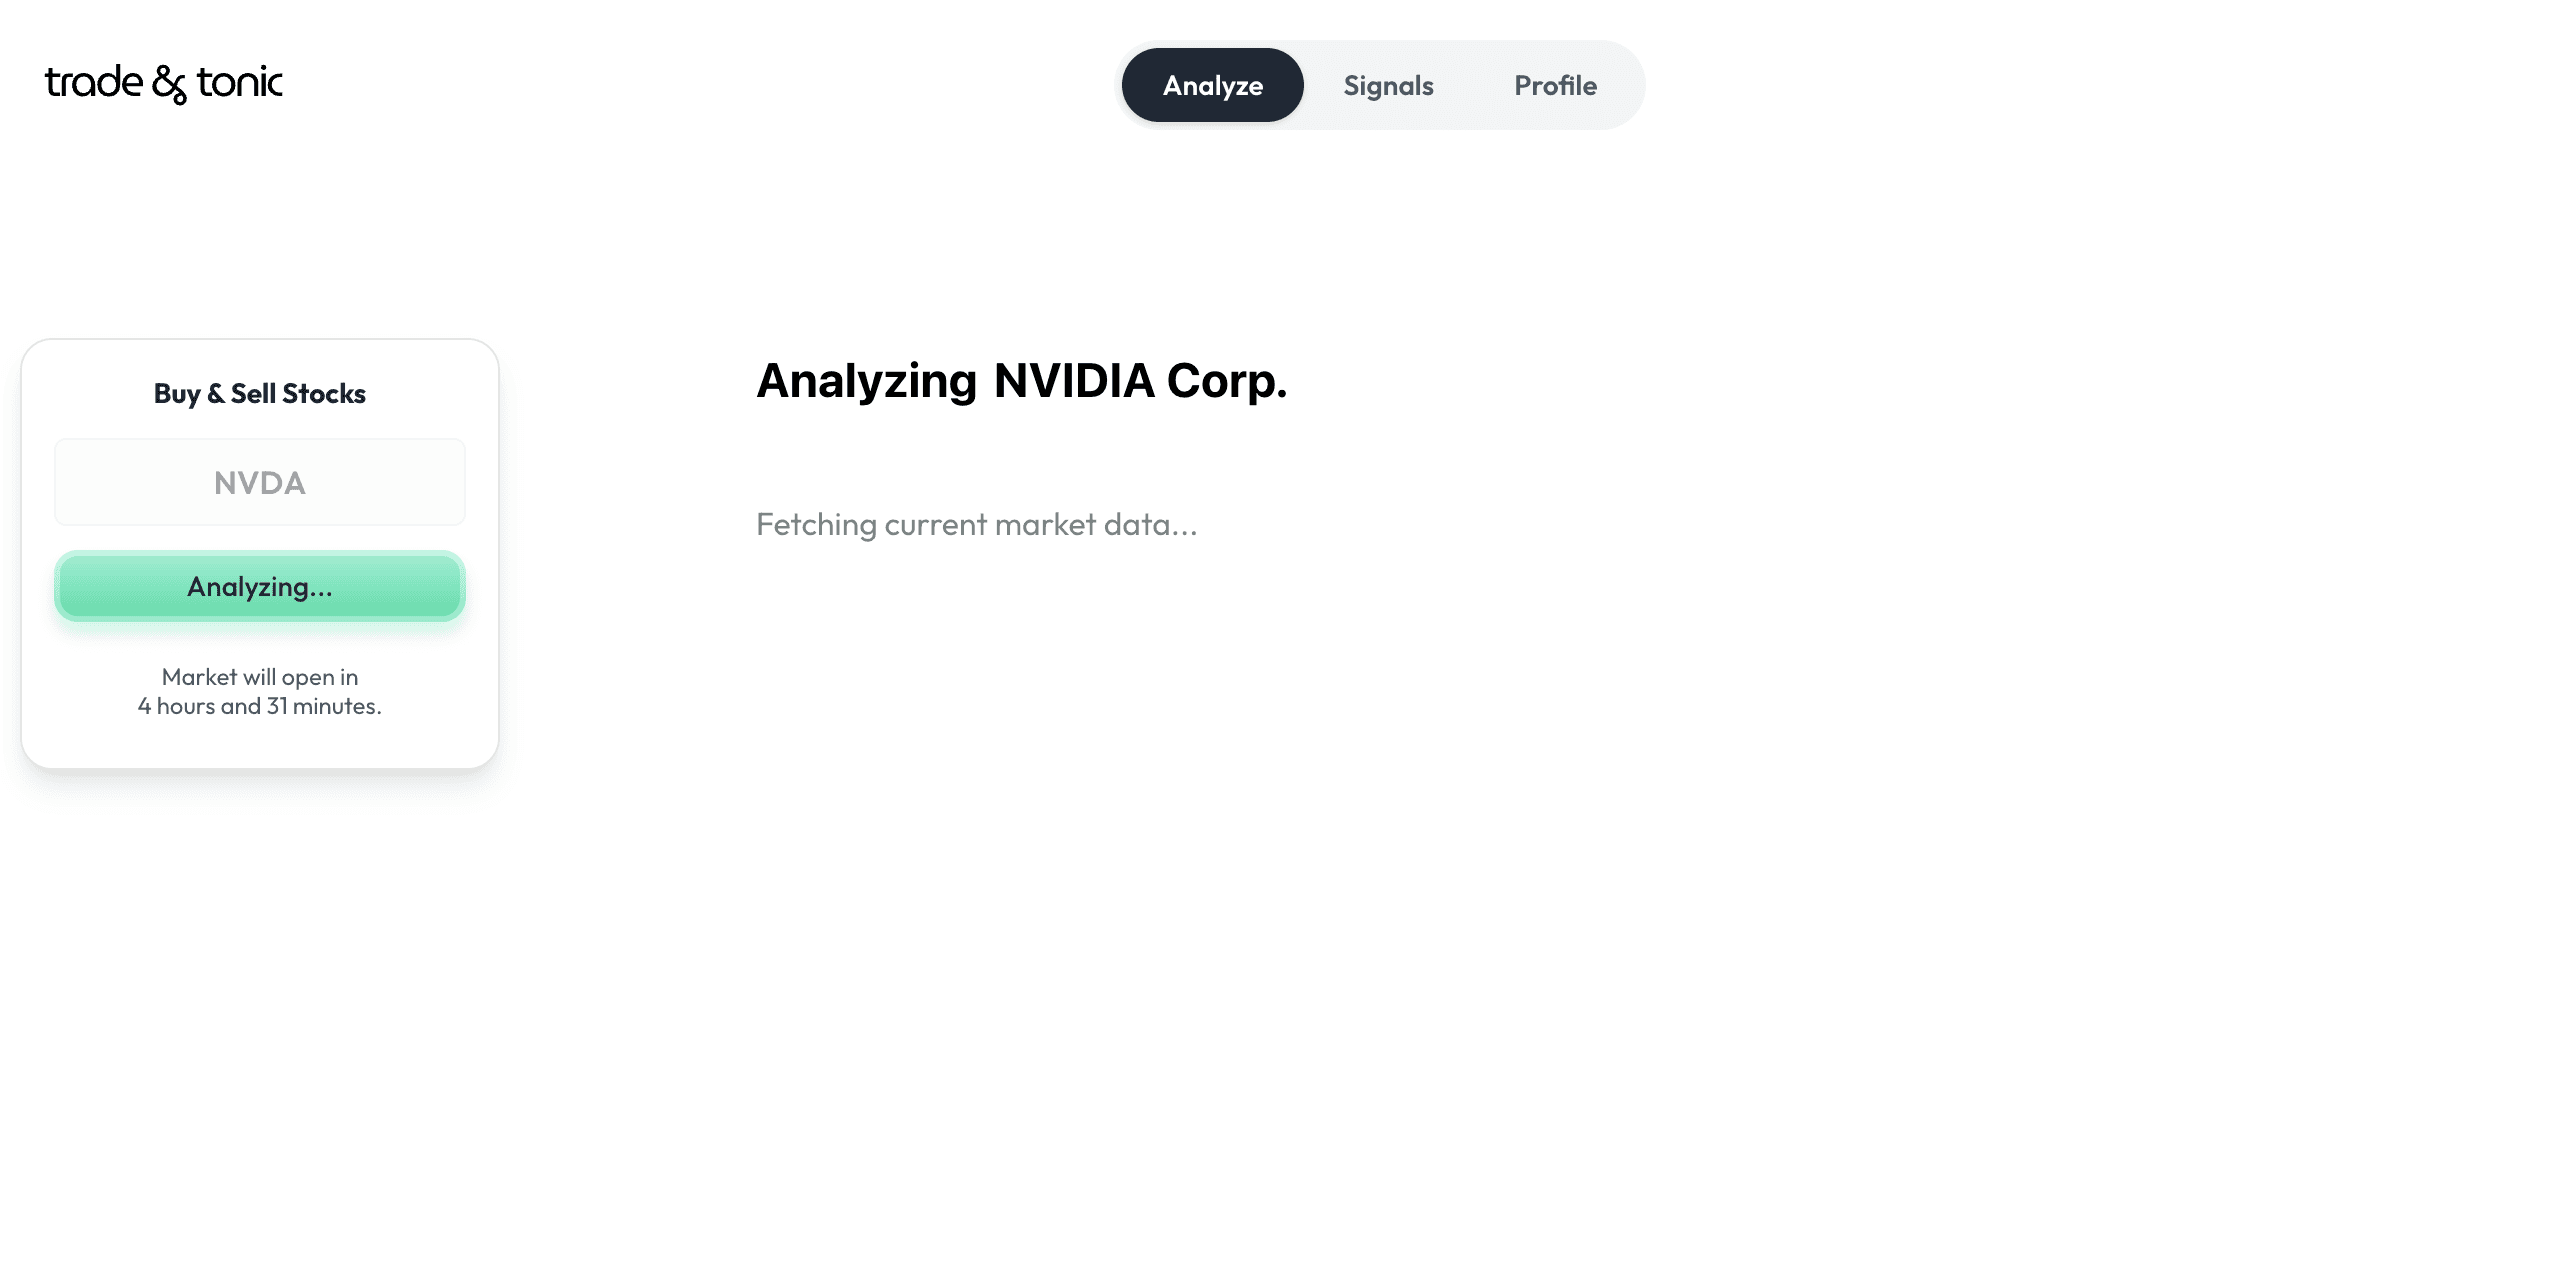
Step 2: Let the AI agents run their full check
Behind the scenes, trade & tonic spins up a team of specialized AI agents that each look at a different slice of Nvidia: chart patterns and price action, financial statements, news sentiment, macro conditions.
These agents work in parallel, so even though they’re analyzing multiple data feeds at once, the full analysis usually finishes in about 1 minute and can run even when the market is closed using the latest available data.
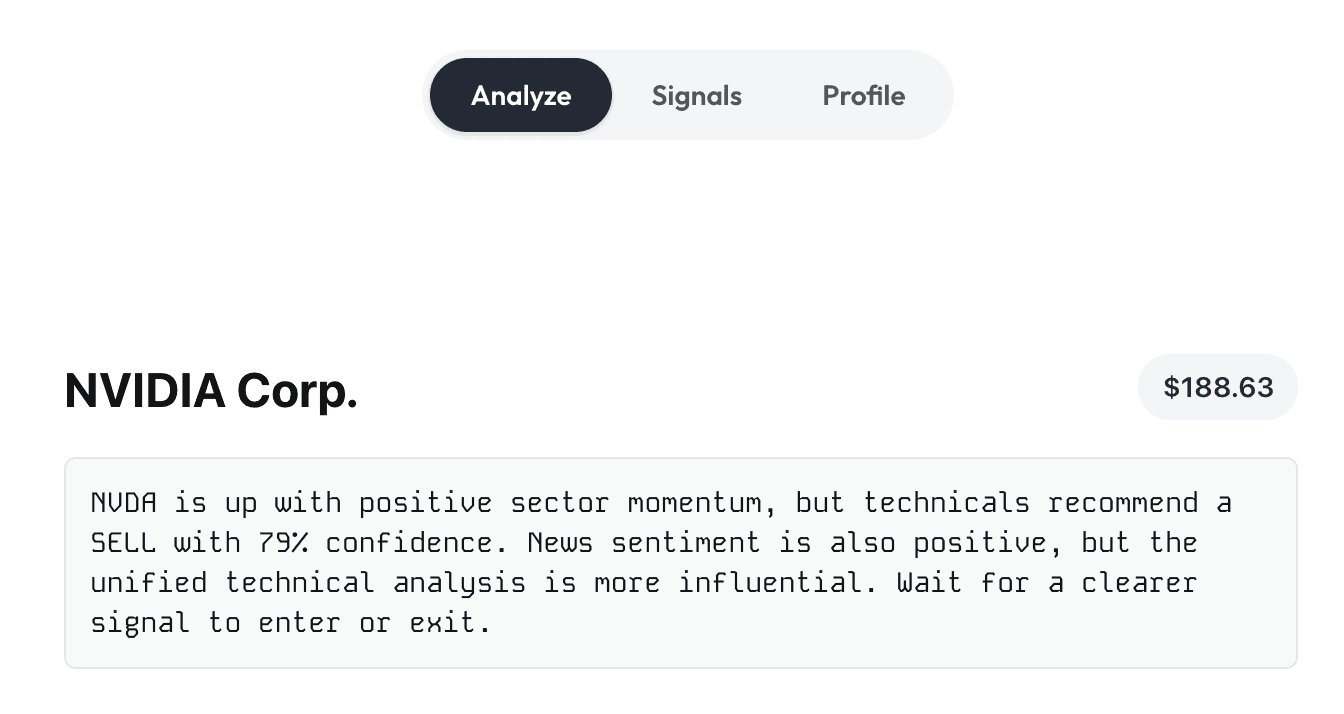
Step 3: Read the main verdict and confidence score
Once the run completes, you land on a summary view showing a clear market verdict for Nvidia: BUY, SELL, or HOLD, generated from the combined agent signals.
Next to this, you see a confidence score (0–100) that shows how strongly the agents agree on that call, helping you distinguish between high‑conviction setups and “mixed signal” situations.
For a full stock check, only the first 3 steps are truly mandatory, and everything that comes after - digging into technicals, fundamentals, news, macro context, individual agent views, and backtests - is optional depth that helps you understand why the AI reached that call and how it fits your own risk profile and strategy.
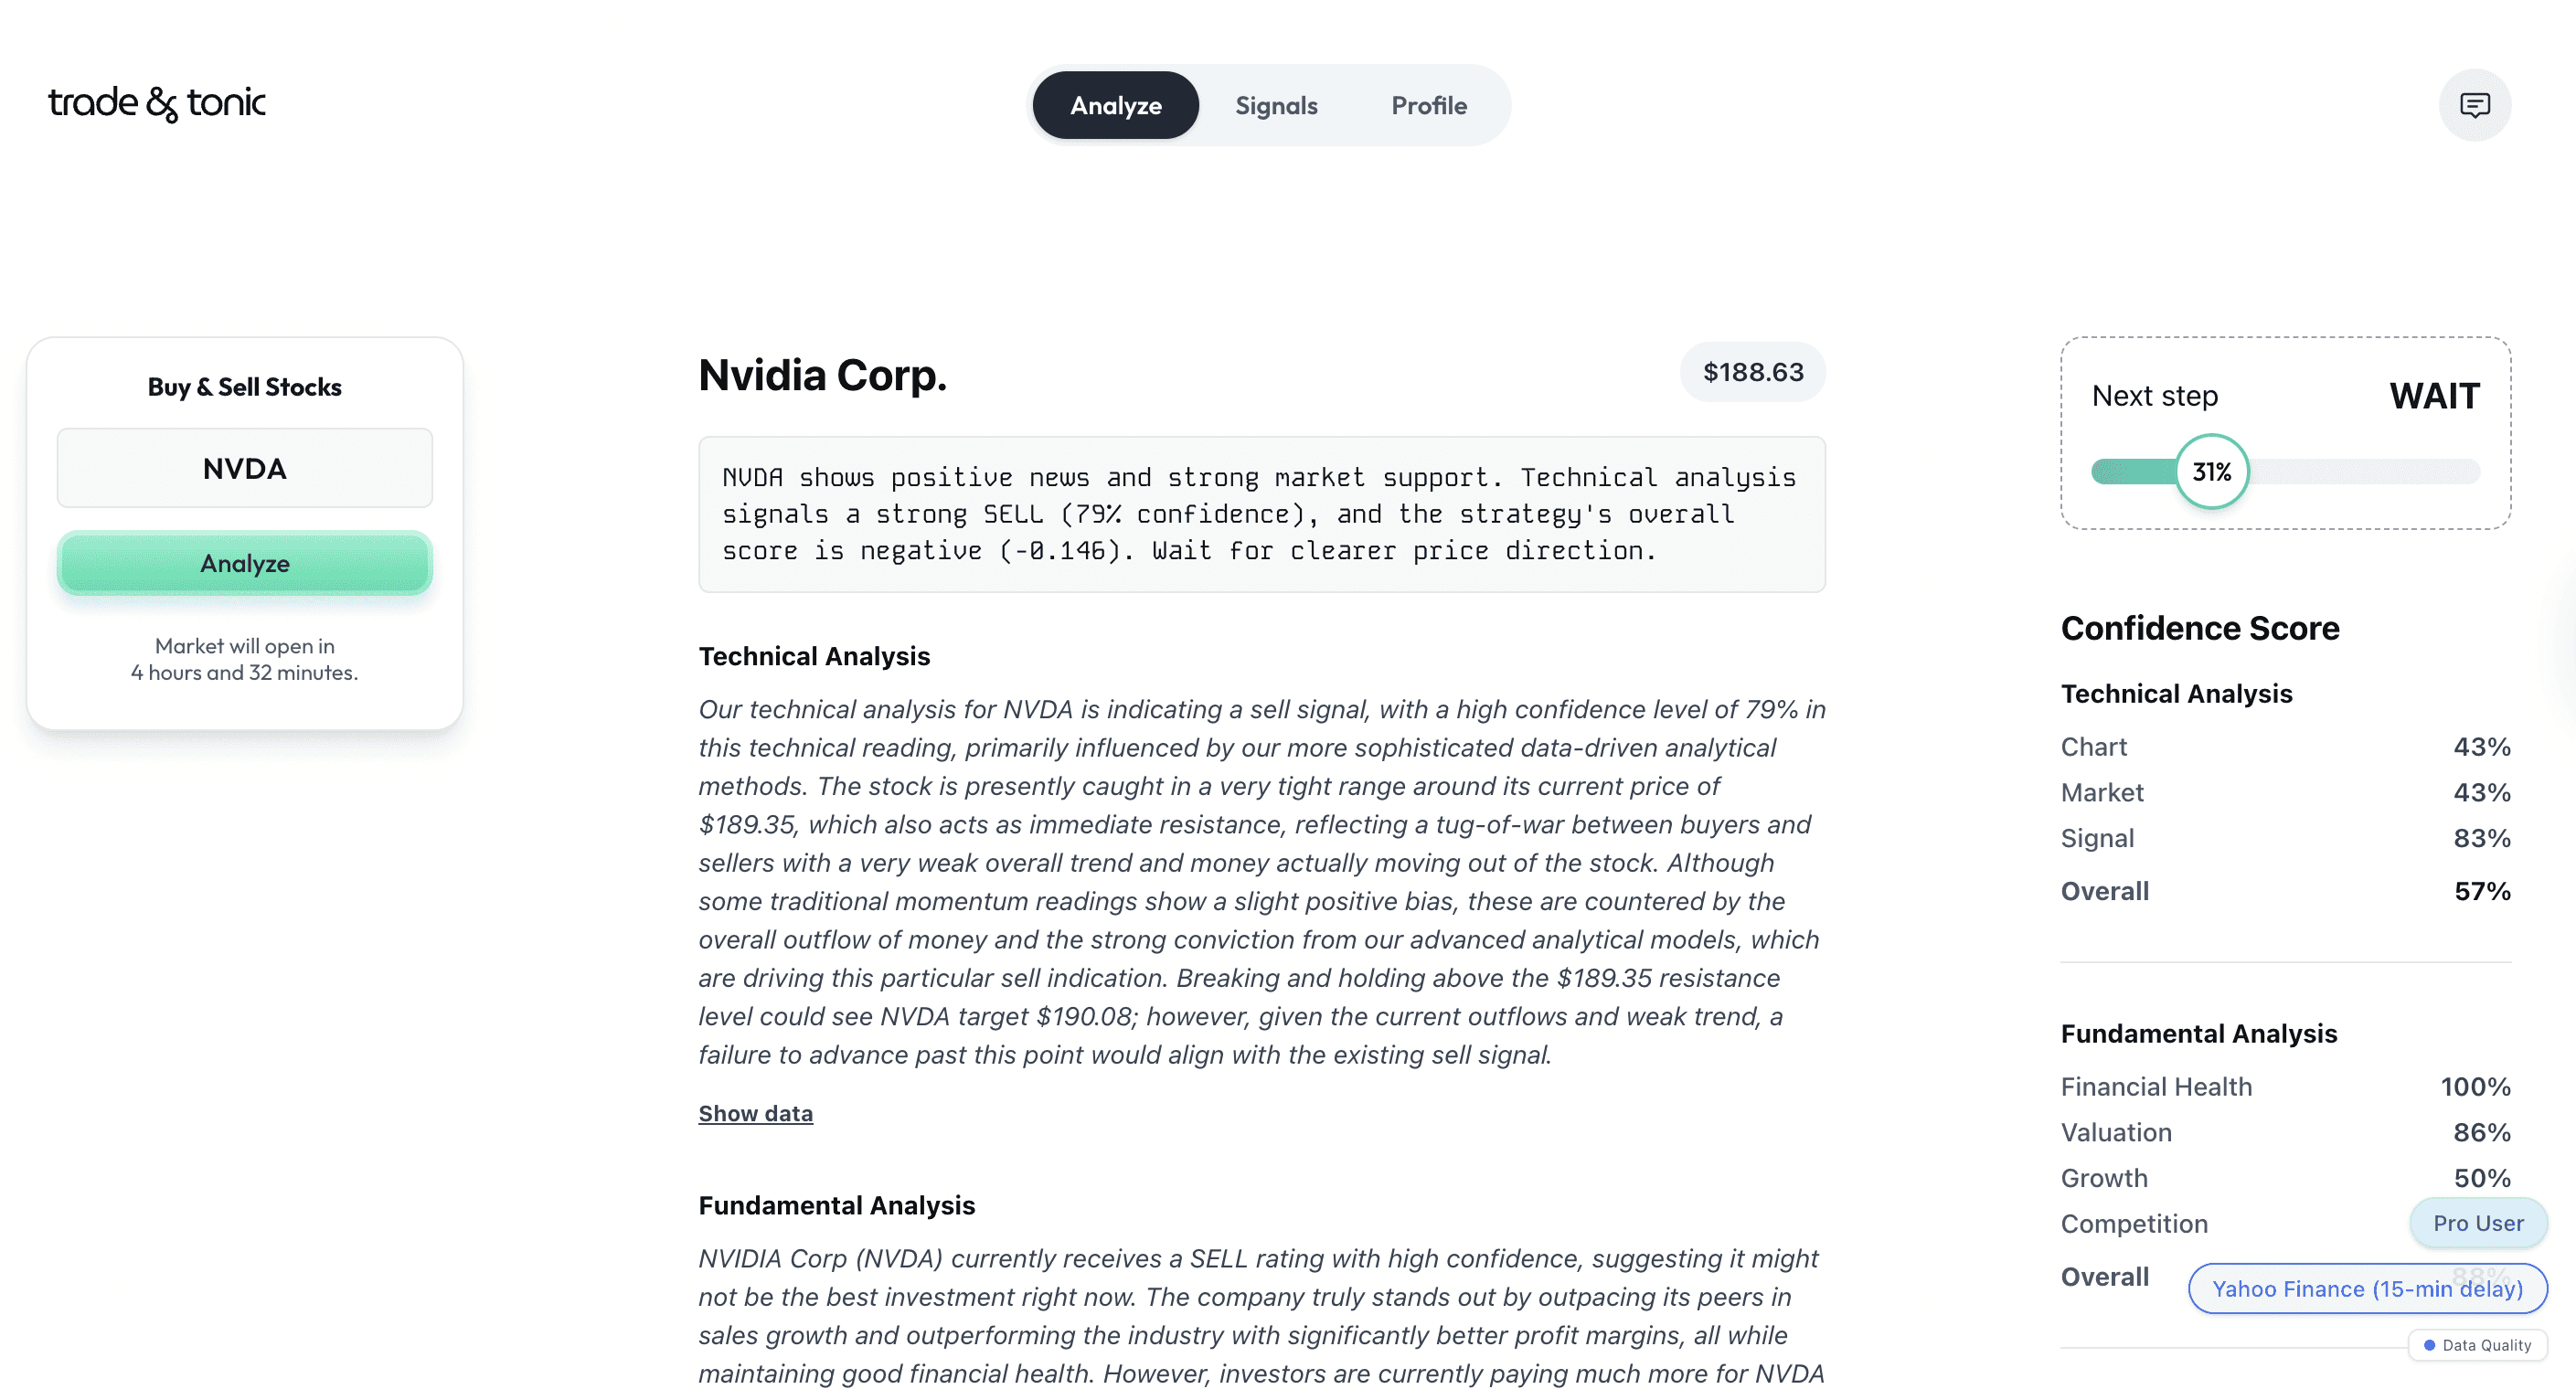
Review the high‑level thesis
Under the verdict, trade & tonic presents a concise written thesis explaining why it reached this conclusion on NVDA, distilling the most important points from the different agents.
This thesis highlights the key drivers, for example, whether recent earnings momentum, valuation, technical trend, or news sentiment are the main reasons the AI is bullish, bearish, or neutral.
In the example given, the headline verdict (“SELL – wait for a clearer signal”) comes from blending four main engines: technicals, fundamentals, news sentiment, and macro/market context, each with its own confidence score and quality rating.
When these engines disagree (here, bullish sector and news vs. bearish technicals and stretched valuation), the model weighs them and surfaces the side with stronger evidence, while still explaining the opposing forces so you know why the call isn’t a simple no‑brainer.
From the summary, you can also open the detailed breakdown to see what each agent concluded individually - technical, fundamentals, news, macro, and options - along with their contribution to the final signal.
This allows you to understand, for example, situations where technicals appear strong but fundamentals are weaker, or where news is very positive but macroeconomic agents are more defensive.
Dive into technical analysis
In the technical section, one agent focuses on Nvidia’s price action: trend direction, support and resistance zones, moving averages, volume patterns, and other core indicators across several different timeframes.
This view helps you see whether NVDA is in an uptrend or downtrend, if it’s extended or consolidating, and how the short‑term setup aligns (or conflicts) with the longer‑term structure.
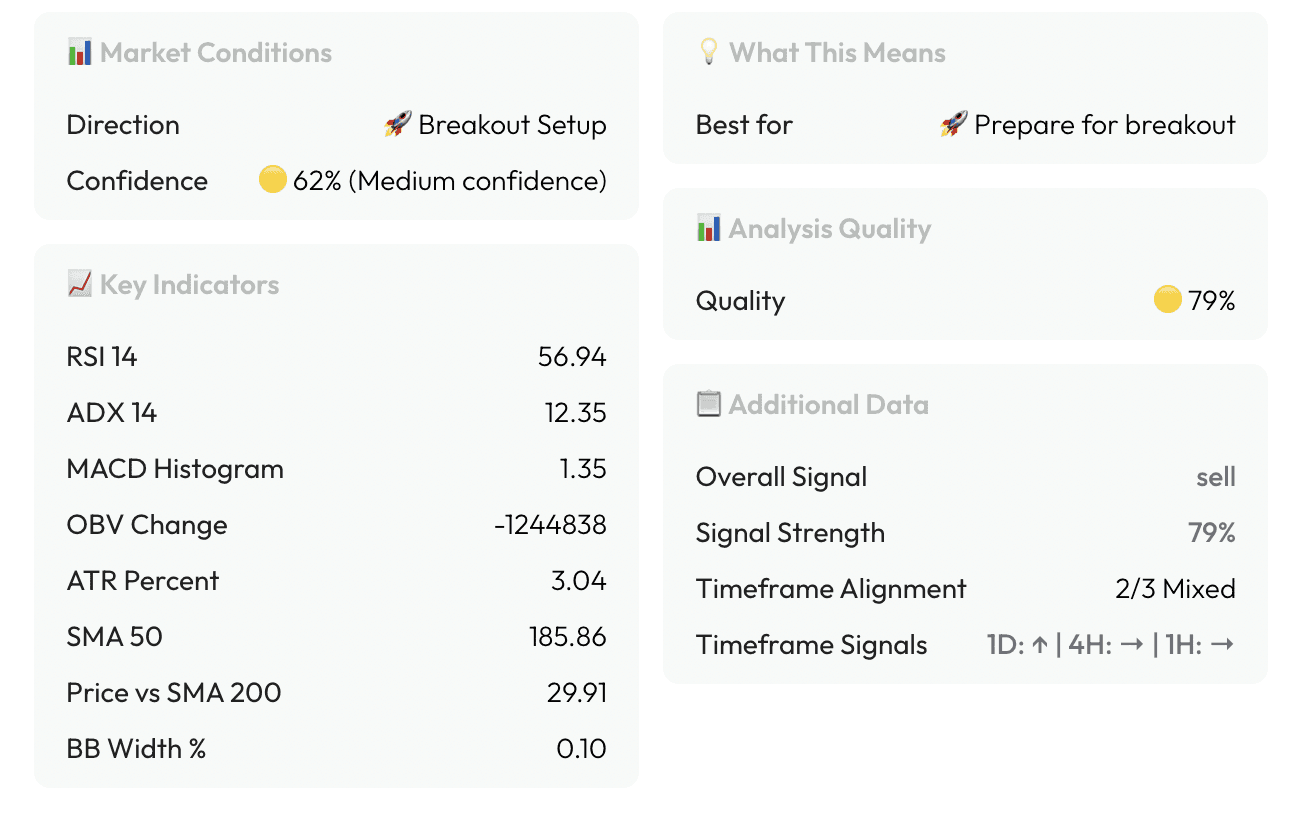
The technical block flags a SELL with 79% confidence, noting a weak trend, neutral momentum, and clear money outflows, despite some traditional indicators flashing slightly bullish, all while price is pressing a key resistance zone.
It also quantifies conditions using indicators like RSI, ADX, MACD, OBV, ATR, moving averages, and Bollinger Band width, then summarizes what this cocktail means in plain language (e.g., “prepare for breakout, but risk is skewed to the downside unless price breaks above resistance”).
Check fundamentals and financial health
Another agent analyzes Nvidia’s fundamentals using company financials: revenue and earnings growth, profitability margins, balance‑sheet strength, valuation ratios, and other key metrics.
Here you can see whether the AI believes NVDA’s business performance and valuation justify the current price, or if fundamentals are lagging behind the technical picture.
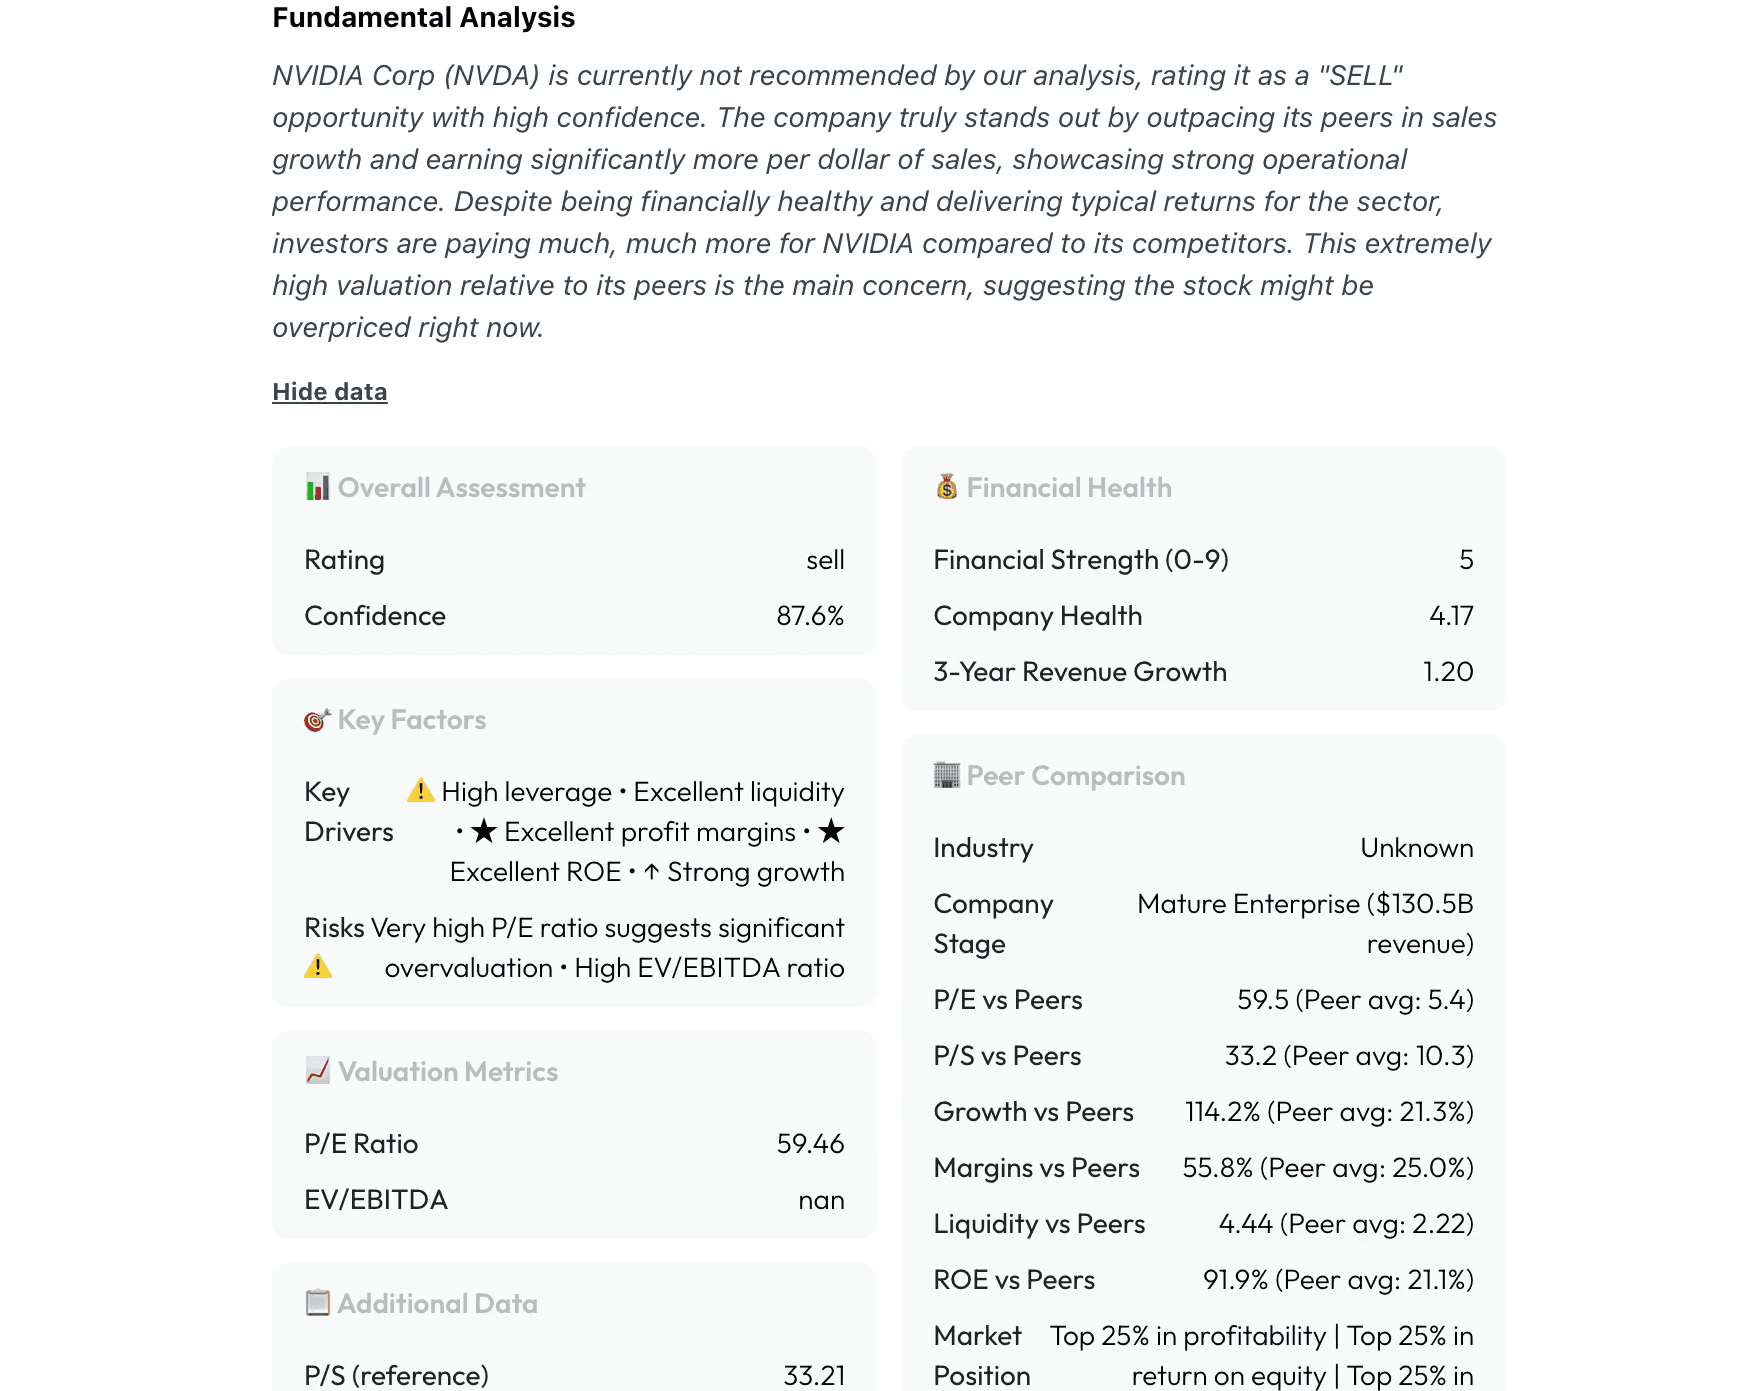
Fundamentally, the engine sees an excellent business - strong growth, margins, ROE, and liquidity - yet still rates the opportunity as SELL because investors are paying dramatically more for each dollar of earnings and sales than they are for close peers.
Peer comparisons show valuation multiples (P/E, P/S, EV/EBITDA) towering over competitors like AVGO, TSM, AMD, INTC, and QCOM, while profitability and balance‑sheet metrics sit in the top quartile, making “great company, aggressive price” the core thesis.
Assess news and sentiment
The news‑sentiment agent scans recent headlines and articles mentioning Nvidia, categorizing them into positive, negative, or mixed signals and measuring overall tone.
This helps you quickly understand whether recent narratives and catalysts, such as product launches, regulation, or macro headlines, are acting as a tailwind or headwind for the stock.
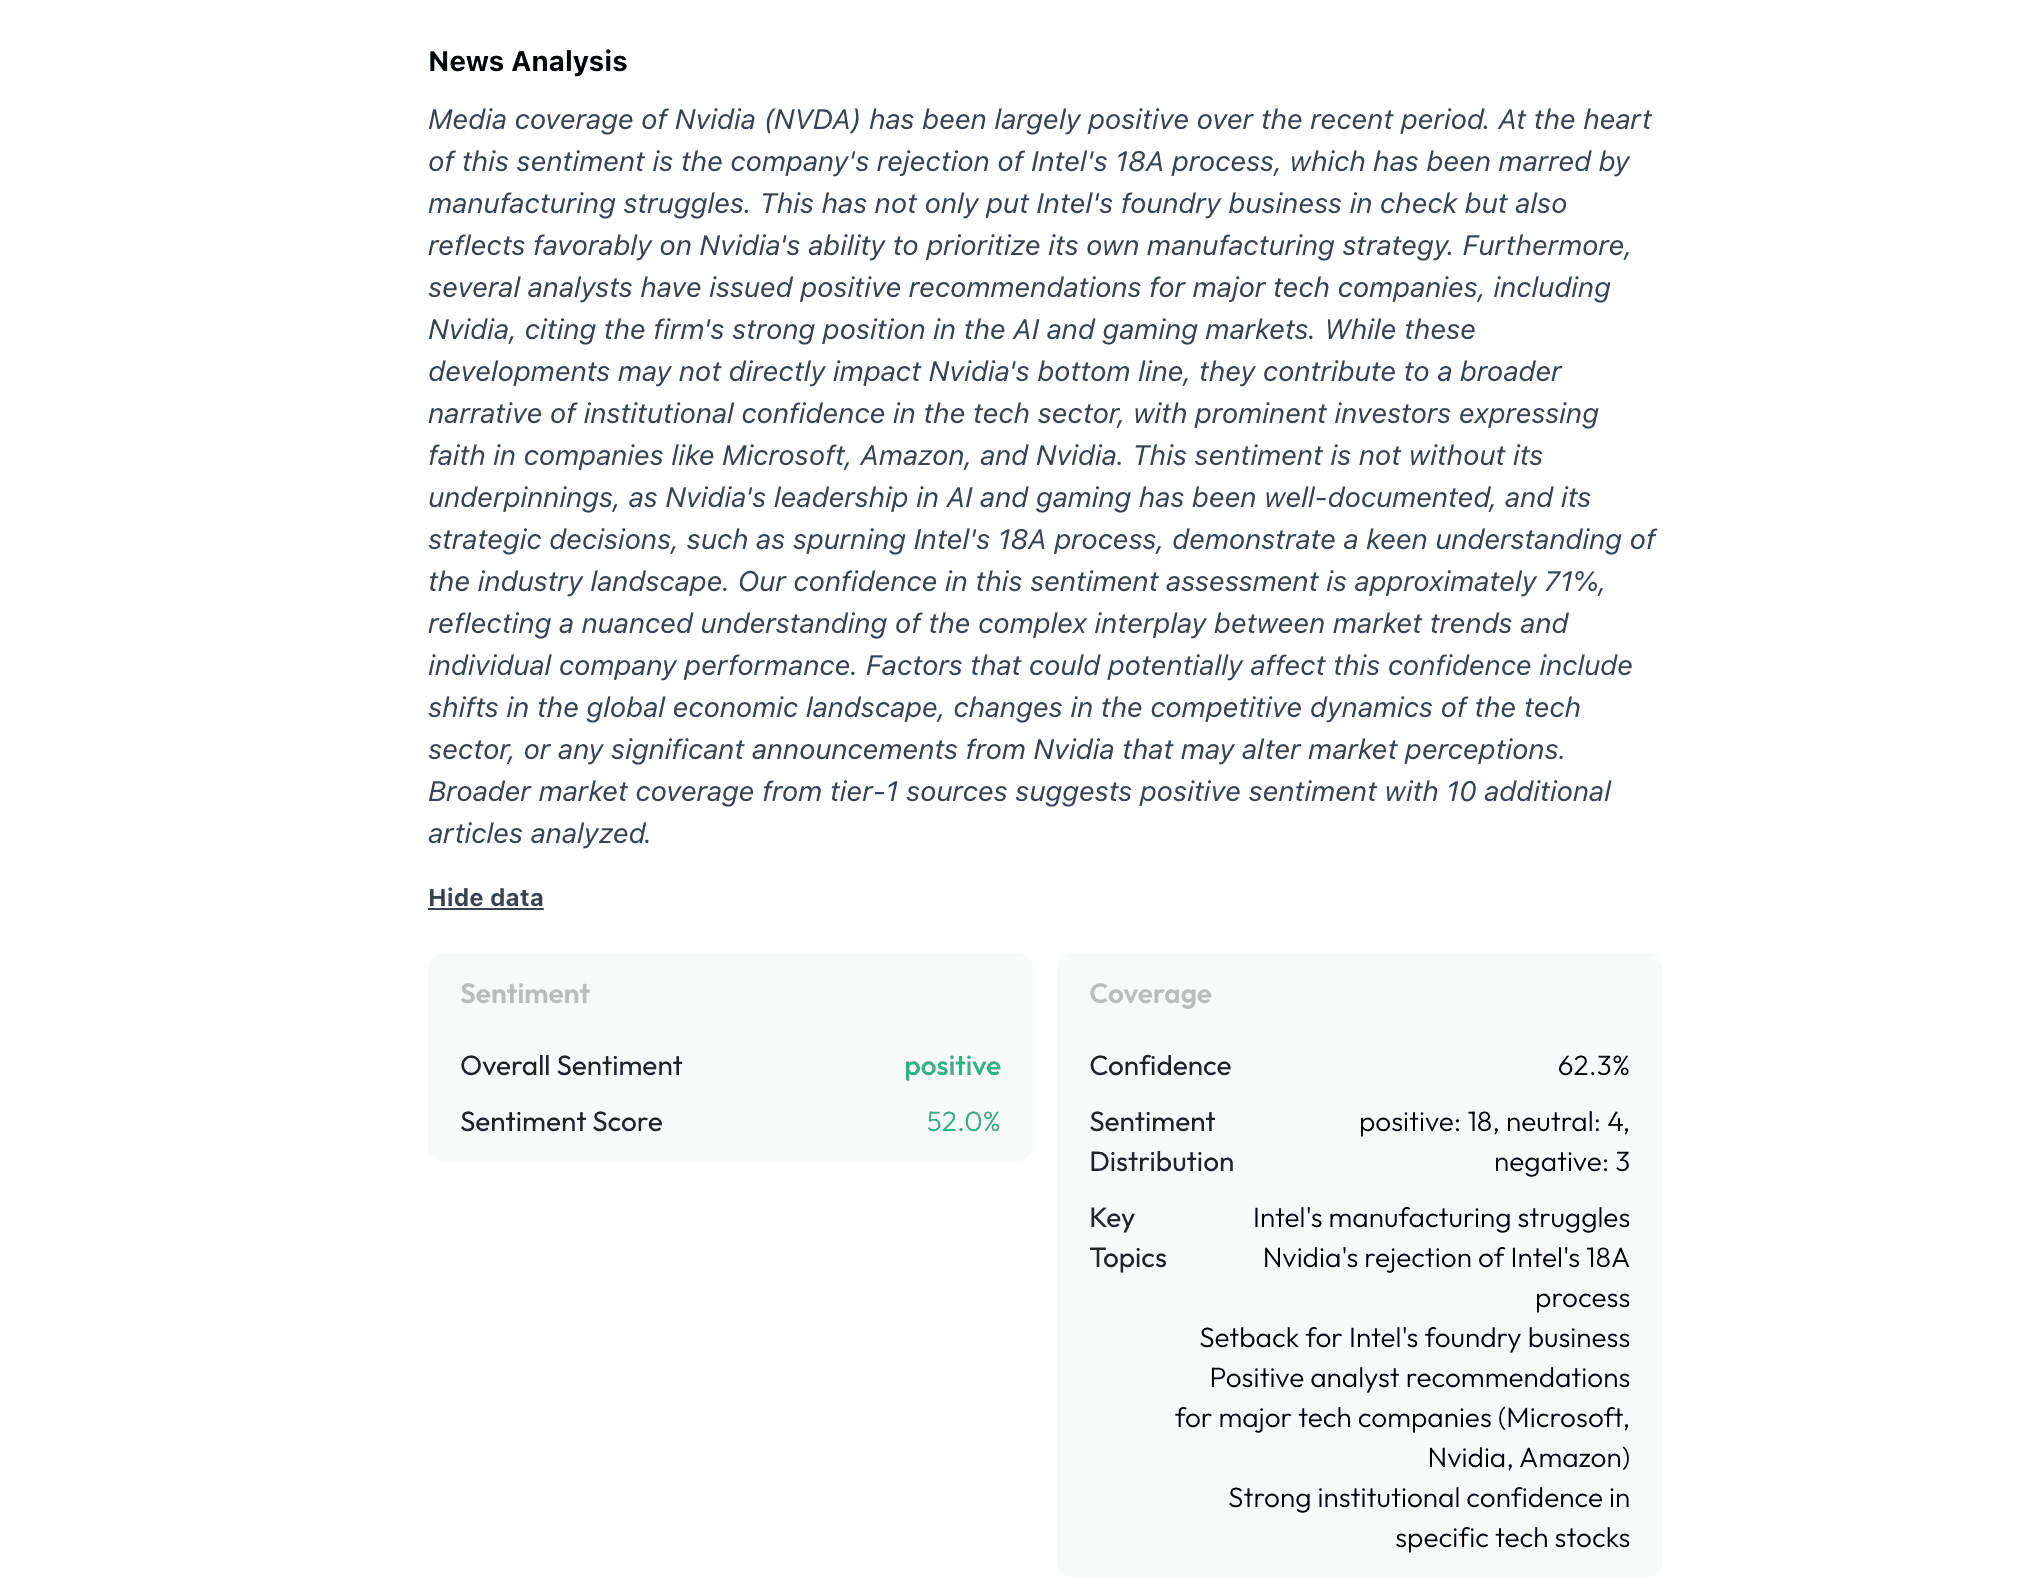
In the example given, the news module scores sentiment as positive, driven by topics such as product strength, AI leadership, and strategic manufacturing choices that reflect well on management and long‑term positioning.
It counts and classifies recent articles (positive/neutral/negative), evaluates source quality and freshness, and then condenses the overall narrative into a single sentiment score with a confidence estimate so you can see whether the hype is broad‑based or narrow.
Consider macro and risk context
Dedicated agents look at broader market and sector conditions that affect Nvidia, such as index trends, interest‑rate environment, and tech/semiconductor sector momentum.
A risk view summarizes how volatile the current backdrop is and whether conditions favor taking risk in NVDA or suggest more caution, aligning the stock call with the macro picture.
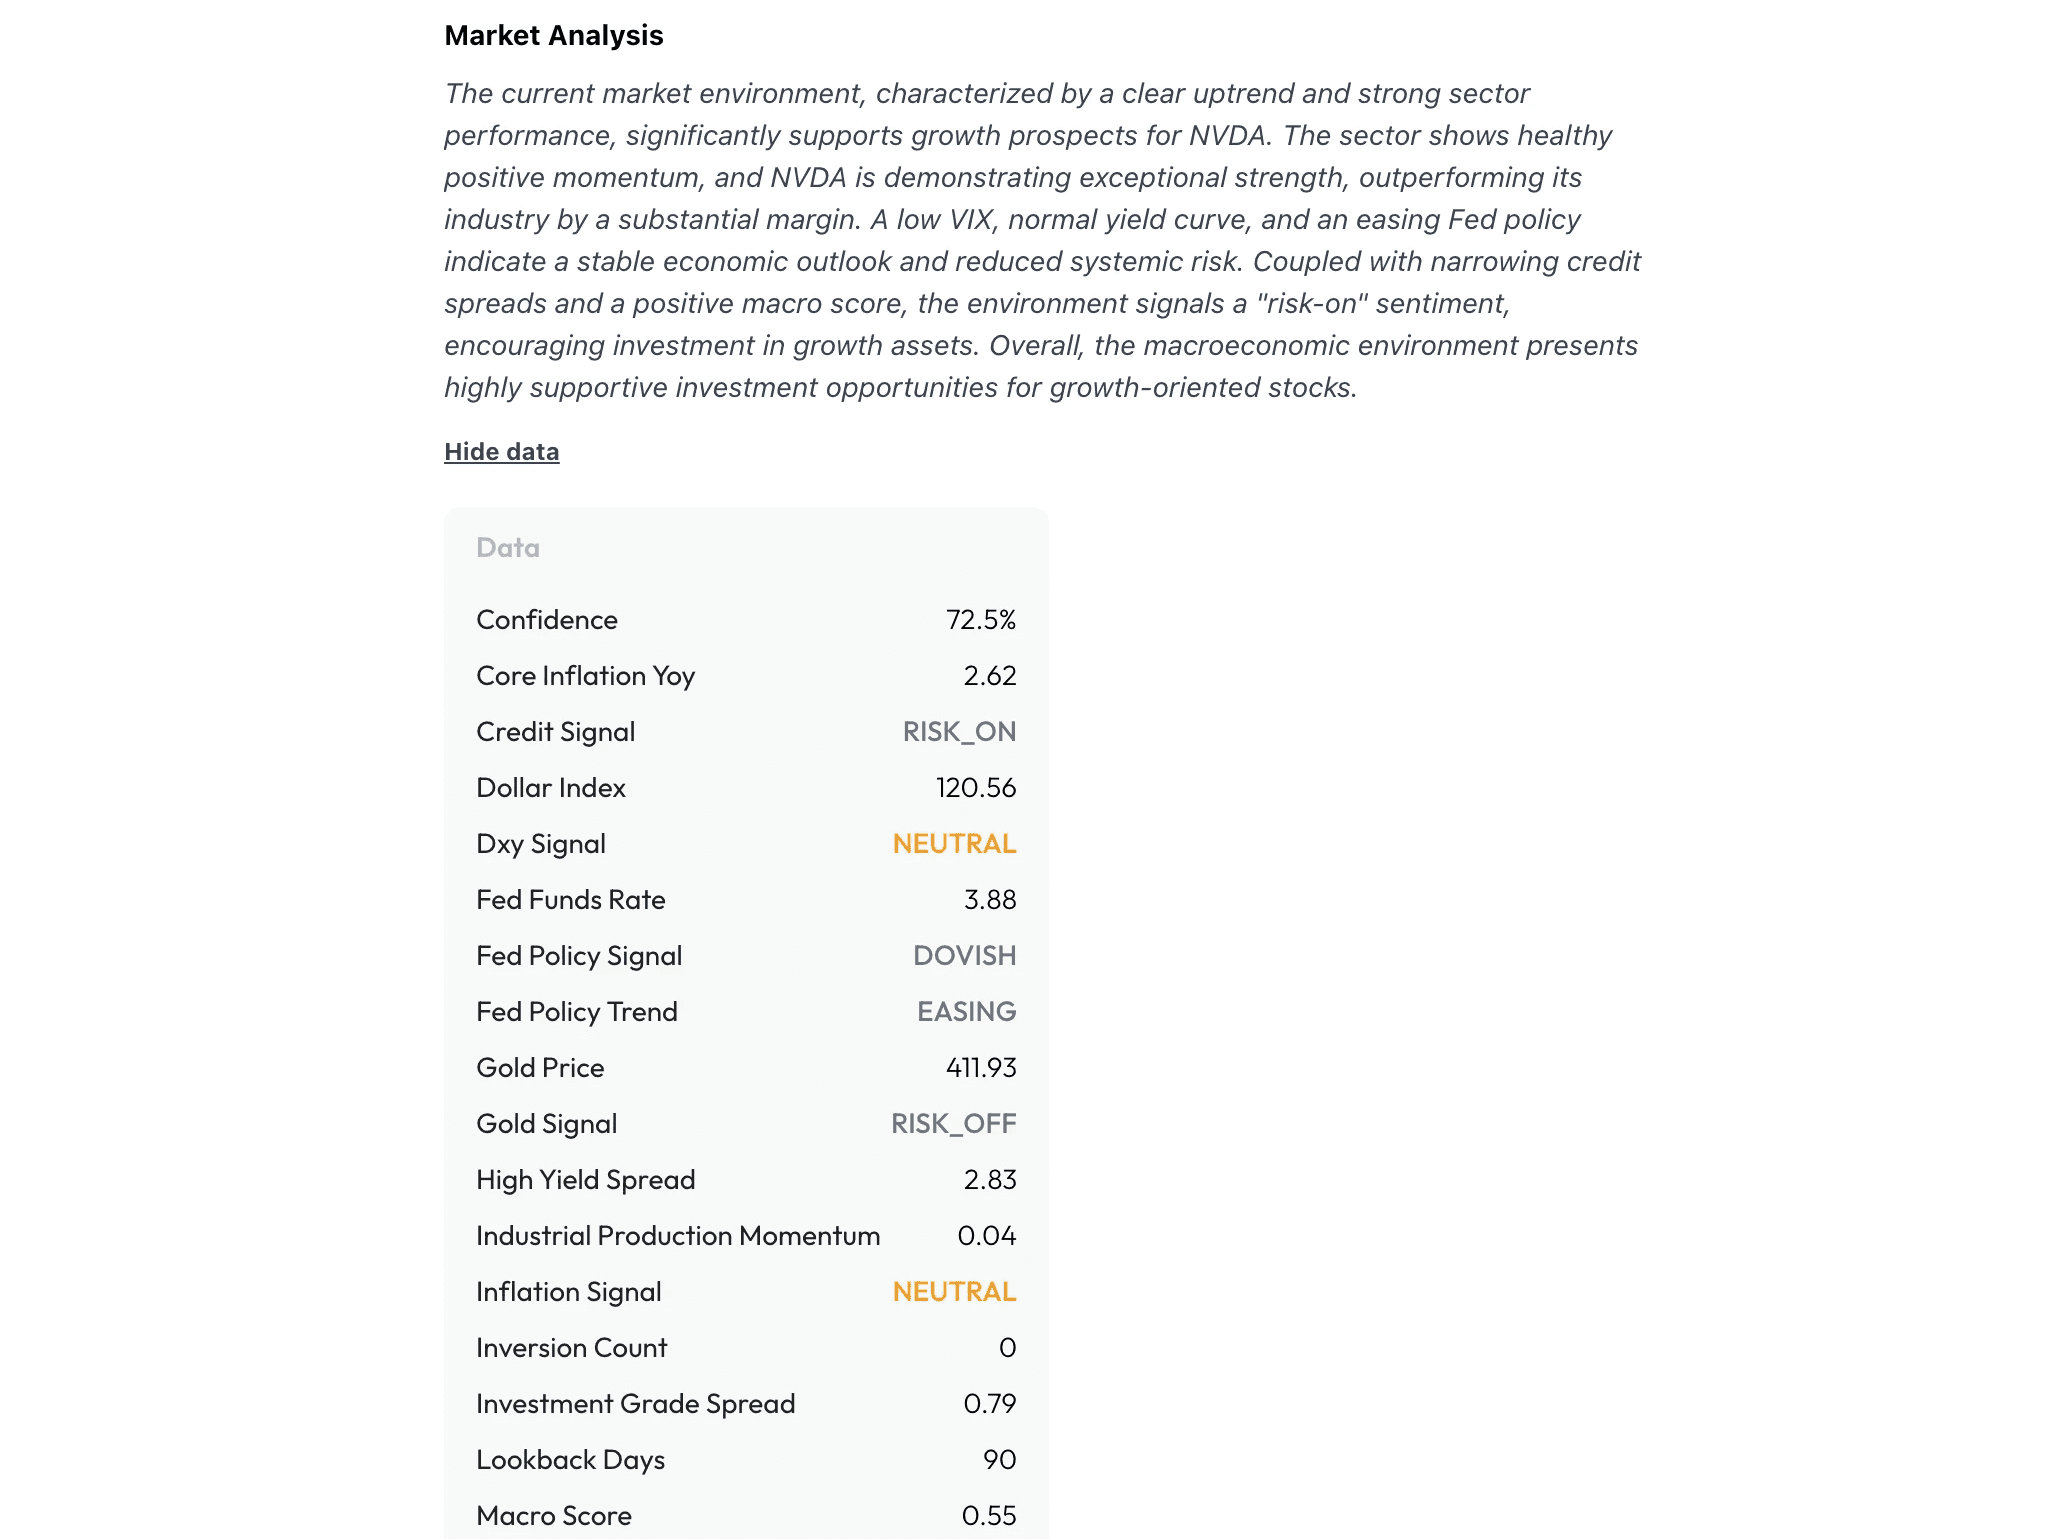
The macro/market block reports a supportive backdrop: index uptrend, strong sector performance, low volatility regime, dovish central‑bank stance, and healthy credit spreads pointing to a risk‑on environment for growth assets.
It tracks indicators like inflation, unemployment, oil and production signals, VIX regime, sector ETF momentum, and multiple yield‑curve slopes, then rolls them into a single macro score and “Next step” suggestion, which in this case still comes out as WAIT, because stock‑specific technical and valuation risks outweigh the otherwise friendly macro tide.
Use history and backtesting for context
trade & tonic tracks previous Nvidia analyses and their outcomes, so you can review how past BUY/SELL/HOLD calls performed over time in terms of win rate, average return, and risk‑adjusted metrics.
Looking at this history helps you decide how much weight to give the current NVDA verdict and whether specific patterns (such as post‑earnings setups) have historically worked well.
Turn insight into an action plan
After you’ve reviewed the verdict, confidence score, and key agent insights, you can translate the analysis into a concrete plan: whether to buy, trim, hold, or avoid NVDA, and at what time horizon.
trade & tonic does not execute trades; instead, you take this clarified thesis and use your regular broker to place orders, with a clear understanding of the reasons and risks behind your decision.
TL;DR
How should beginners use trade & tonic?
As a fast AI research assistant that turns any ticker into a clear BUY/SELL/HOLD view with explanations, not as an autopilot that makes decisions for them.
What are the only “must‑do” steps?
Type the ticker, let the AI run, and read the verdict with its confidence score and short thesis; everything else in the platform is optional depth when you want to dig further.
What should I review before acting on a signal?
Whether the AI’s technical view, fundamentals, news sentiment, and macro backdrop match your own time horizon, risk tolerance, and plan for sizing, entries, and exits.
Does trade & tonic replace investor judgment?
No. It compresses complex data into a single view so you can make faster, more informed decisions, but you still choose if and how to trade the idea.
Why does this approach reduce mistakes?
Because it forces you to see the full picture - price action, valuation, narrative, and market context - before acting, instead of chasing headlines or one indicator in isolation.
______________
trade & tonic is an intelligent investment analysis platform built for thoughtful investors who want to understand why a stock is a buy, sell, or hold, not just what the signal is. It combines specialized AI agents with time‑tested investing principles to deliver transparent, easy‑to‑read insights that replace dashboard overload with one clear decision and a thesis you can trust.
👉 Get Early Access
Learn more
Discover more from the latest posts.