Feb 9, 2026
Stock Analysis for Long-Term Investors: How to Read Buy/Sell/Hold Signals
Q: How should a beginner read stock analysis for long-term investing?
A: Focus on fundamentals (business quality + fair price), use technicals for timing, ignore short-term news noise. Use our simple 7-point checklist to decide buy/hold/sell.
If you’re investing for the next 5–10 years, not the next 5–10 days, you need to read stock analysis very differently from traders. Most platforms throw a mix of charts, ratios, and headlines at you yet what matters for long-term investors is much simpler: understanding the business, its financial strength, and whether the current price makes sense over time.
1. Start with the goal: long-term, not trading
Legendary investor Warren Buffett famously said, “If you aren’t willing to own a stock for ten years, don’t even think about owning it for ten minutes.” That’s the mindset shift: you’re buying part of a business, not a lottery ticket.
For long-term investors, the key question isn’t “Will this stock go up next week?” but “Is this company strong enough to grow value for years, through different market cycles?” Day‑to‑day price moves and short-term volatility matter far less than the durability of the business and its ability to compound earnings.
2. The three pillars of stock analysis
Most serious sources group stock analysis into three big buckets: fundamentals (the business), technicals (the price and volume), and sentiment/news (how the market feels about it). Long-term investors lean heavily on fundamentals, use technicals for timing, and treat news carefully to separate noise from real change.
a) Fundamental analysis: “Is this a great business at a fair price?”
Fundamental analysis looks at the company itself, its business model, competitive position, and financial health, to estimate its true value. Britannica describes it as understanding earnings, competition, and economic trends to see whether a stock belongs in your portfolio.
Key areas to focus on:
Business model and moat
What does the company do, how does it make money, and who are its customers?
Does it have an economic moat—brand, technology, network effects, switching costs, or regulation that protect it from competitors?
Peter Lynch summed it up perfectly: “Know what you own, and know why you own it.” Long-term investors should be able to explain a company in a few simple sentences.
Financial health and growth
Revenue and earnings growth: Look for consistent growth over 3–5+ years, not just one great quarter.
Profit margins: Stable or rising margins suggest pricing power and efficient operations.
Balance sheet: Check debt‑to‑equity (ideally below 1 for many sectors) and positive, growing free cash flow. Benjamin Graham defined a good business simply: it generates more cash than it consumes and keeps finding productive ways to use it.
Valuation: price vs quality
Ratios like P/E or EV/EBITDA help you compare a stock to its sector and its own history.P/E Ratio (Price-to-Earnings) shows how much you're paying for each dollar of the company's profits.
Formula: P/E = Stock Price ÷ Earnings Per Share (EPS).
EPS is "profit per share" (company's total profit ÷ total shares).
Example: Stock at $100, EPS $5 → P/E = 20. You pay $20 for every $1 of profit.
What it means:
Low P/E (under 15): Possibly cheap (bargain or slow grower).
Average (15-25): Fair for most stocks.
High (30+): Investors expect fast growth (tech stocks often here).
How to use: Compare to the industry average (e.g., banks ~12, tech ~30) or the stock's 5-year average. Find it on Yahoo Finance under "Statistics."
EV/EBITDA (Enterprise Value to Earnings Before Interest, Taxes, Depreciation & Amortization): Like P/E but accounts for debt, making it better for fair comparisons.
Formula: EV/EBITDA = (Market Cap + Debt - Cash) ÷ EBITDA.
EV: "True cost to buy the company" (stock value + debt - cash on hand).
EBITDA: Core operating profit (ignores taxes, interest, one-time costs).
Example: EV $105B, EBITDA $15B → 7x. Good range: 5-12 (lower = cheaper).
Why better than P/E?: Ignores debt differences—two similar companies, one loaded with loans? EV/EBITDA shows the risky one as pricier.
How to use: Ideal for long-term; compare across sectors or peers.
Quick comparison table:
Ratio
Beginner Meaning
Formula (Simplified)
Good Beginner Range
Best For Long-Term
P/E
$ paid per $1 profit
Price ÷ EPS
15-25
Quick screen
EV/EBITDA
Total buyout cost per $1 ops profit
EV ÷ EBITDA
6-12
Debt-adjusted
Warren Buffett warns: “It's far better to buy a wonderful company at a fair price than a fair company at a wonderful price.” Ratios spot that fair price.
For long-term investors, fundamental analysis is usually “the right fit” because it focuses on the company’s true value and long-term potential, not on short-term swings.
b) Technicals and price action: “What is the market telling me right now?”
Technical analysis focuses on price, volume, and patterns to understand current market behavior. Charts help identify trends, potential reversal points, and possible entry/exit levels. For long-term investors, the point is not to trade every wiggle, but to:
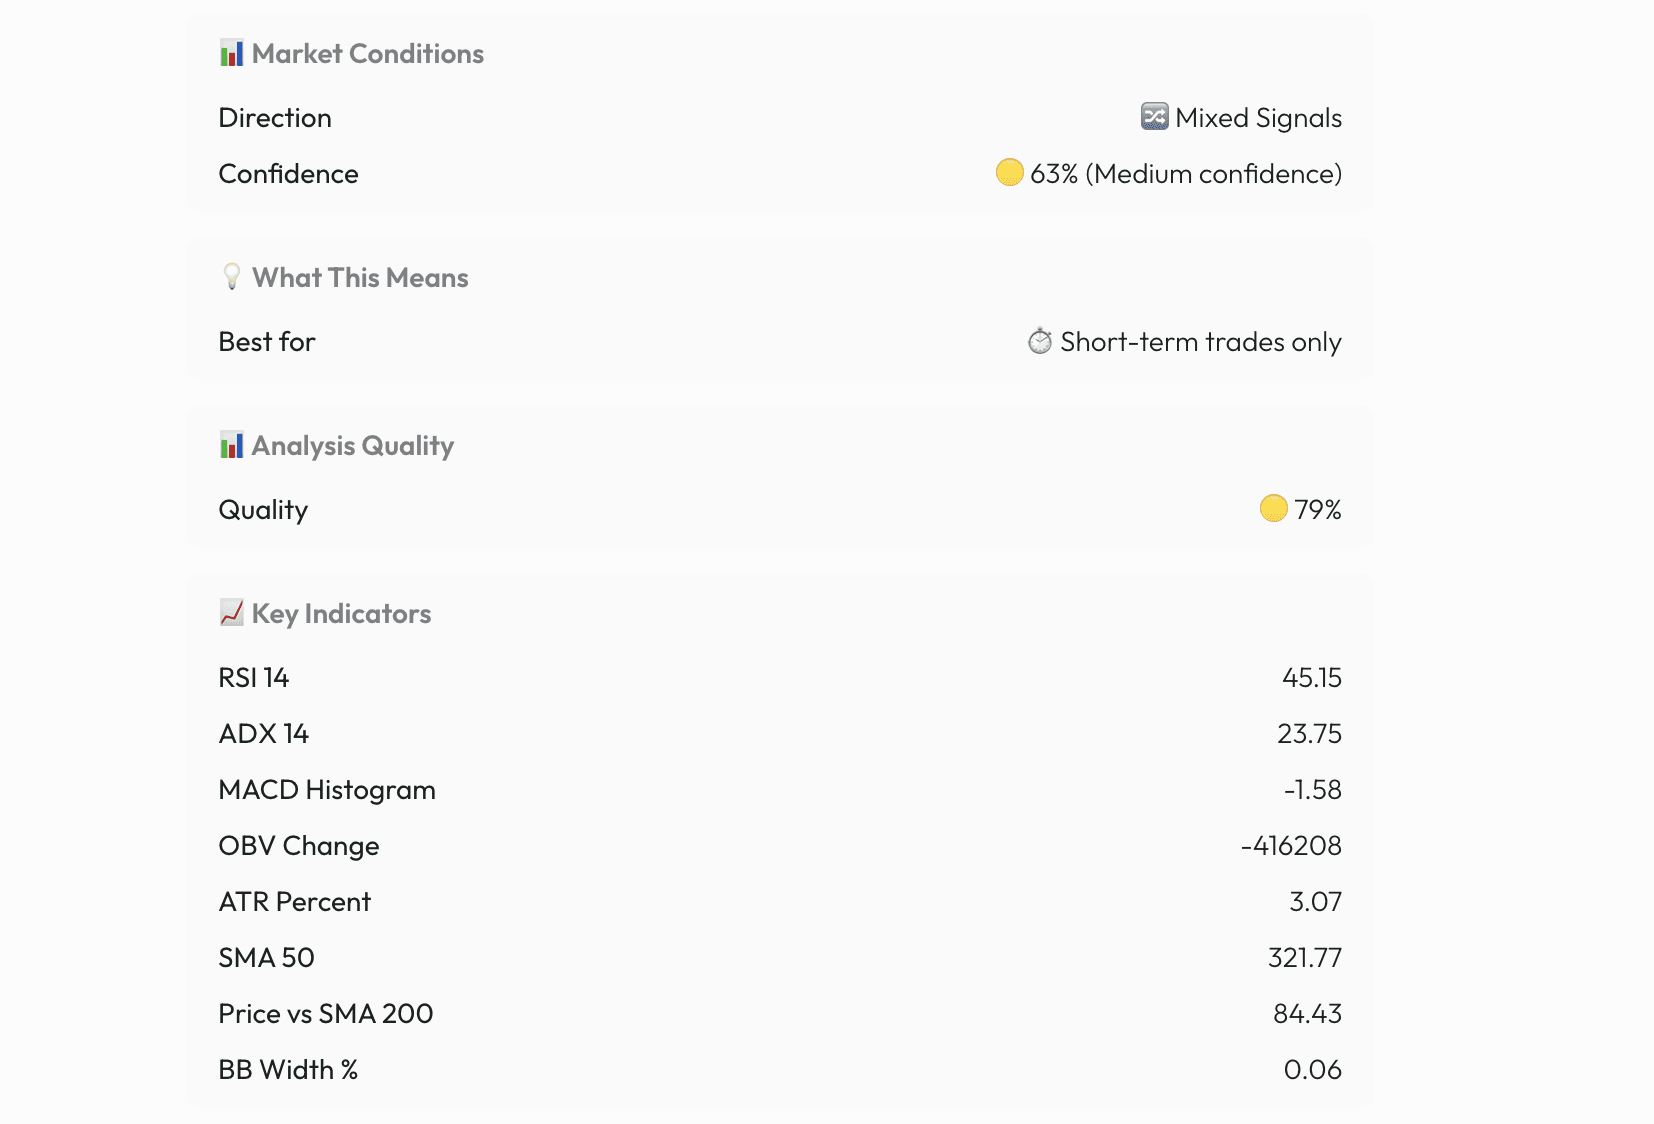
Source of image: trade & tonic technicals analysis
See the trend: Is the stock in a long-term uptrend, downtrend, or sideways range on a 6–24 month chart?
Identify support/resistance: Price zones where buyers or sellers consistently step in can help you avoid chasing euphoric spikes or panic‑selling at obvious support.
Watch volume: Rising volume on up‑moves suggests institutional buying; high volume on down‑moves can signal heavy selling pressure.
Fundamentals are usually the core tool for long-term decisions, while technicals are more used by traders for short‑term entries and exits. As a long-term investor, treat technical “strong sell” or “overbought” signals as context, not automatic instructions. They may affect your timing but shouldn’t overturn a strong fundamental thesis on their own.
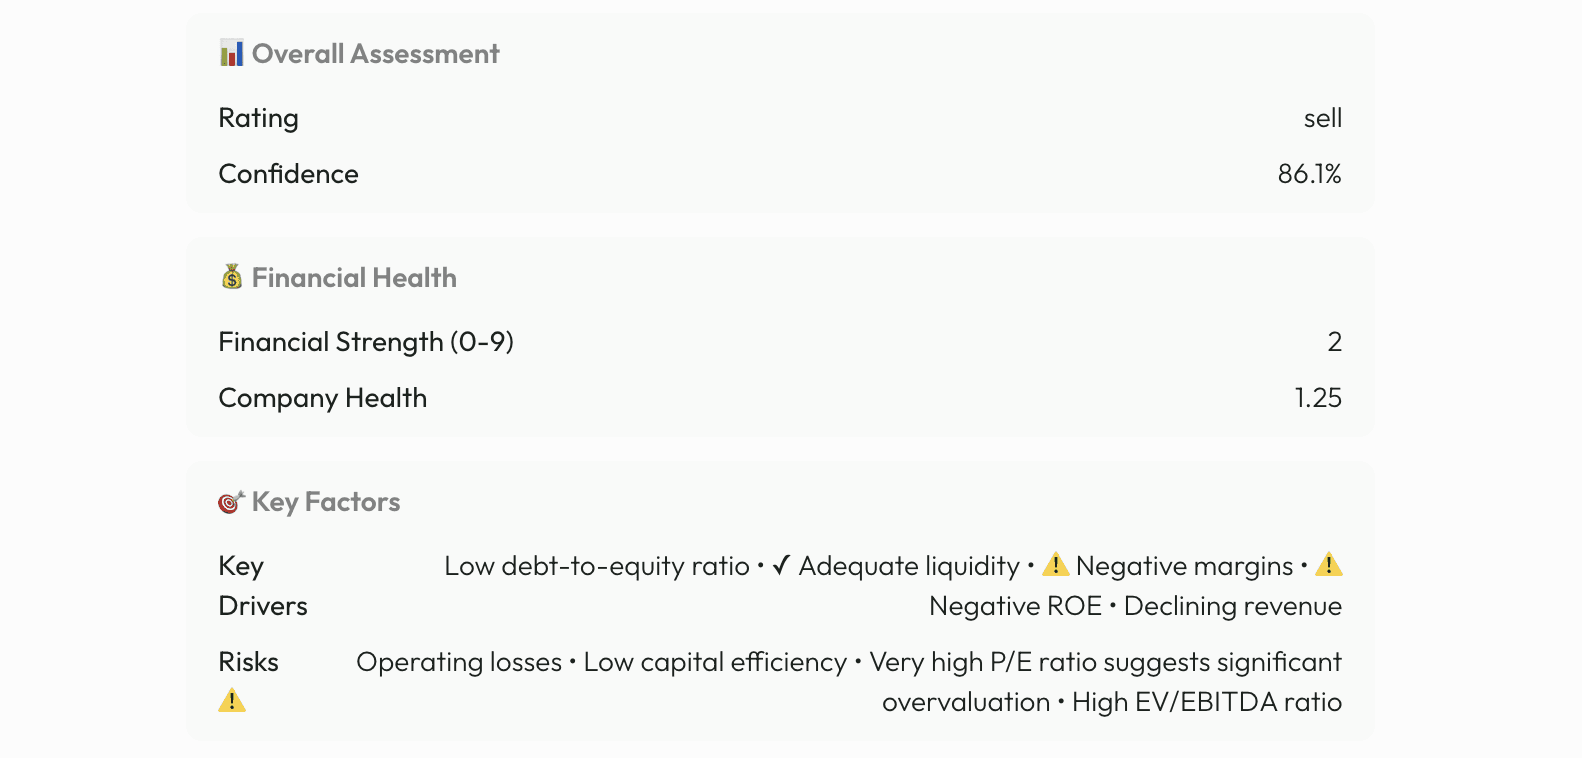
Source of image: trade & tonic fundamental analysis
c) News and sentiment: “Is this noise, or has the story changed?”
News and sentiment analysis look at media coverage, earnings headlines, macro data, and social chatter. The challenge is that markets often overreact in the short term, which can create opportunity or signal real danger.
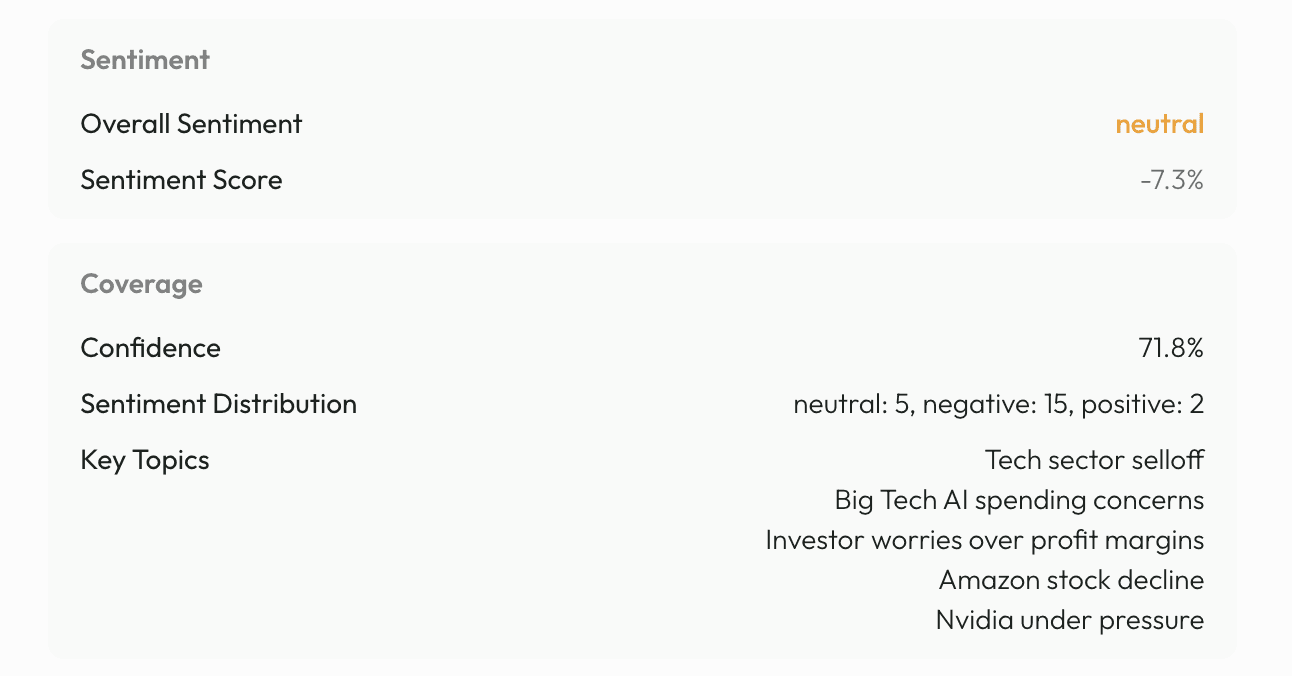
Source of image: trade & tonic news analysis
When you read news:
Classify it as short-term noise vs structural change
Noise: quarterly earnings misses, guidance tweaks, sector rotations, temporary macro fears.
Structural: new regulation that permanently damages the business model, loss of a key competitive advantage, disruptive technology that makes their core product obsolete.
Cross-check with fundamentals
Negative headlines with strong fundamentals can create attractive entry points for patient investors.
Negative headlines plus deteriorating fundamentals can justify reducing or exiting.
FINRA emphasizes evaluating how company-specific factors and broader economic conditions affect a stock, not just reacting to headlines. Long-term investors use news to update their understanding, not to chase every short-term move.
3. A simple long-term stock checklist
Here’s a practical checklist you can run on any stock before deciding to buy, hold, or sell for the next 3–5+ years.
Business
Do I understand how this company makes money and who its customers are?
Will this business still matter in 10 years?
Financials
Is revenue and earnings generally growing over the last 3–5 years?
Are profit margins stable or improving?
Is debt reasonable (e.g., debt‑to‑equity not excessive) and free cash flow positive?
Moat
Does the company have an edge (brand, tech, data, network, regulation) that competitors can’t easily copy?
Valuation (Using P/E and EV/EBITDA)
P/E reasonable vs peers/history? (15-25 often fair).
EV/EBITDA under 12? Adjust for debt via EV.
Price action
Is the stock crashing because the business is broken, or because sentiment temporarily turned risk‑off?
Where are the major support levels on a 1–2 year chart, and how is volume behaving?
News
Has anything fundamentally changed the long-term story, or is this mostly short-term noise?
Decision
Given everything above, is this stock a clear buy, hold, or sell for the next 3–5+ years?
4. A “case study” style example (like GOOGL)
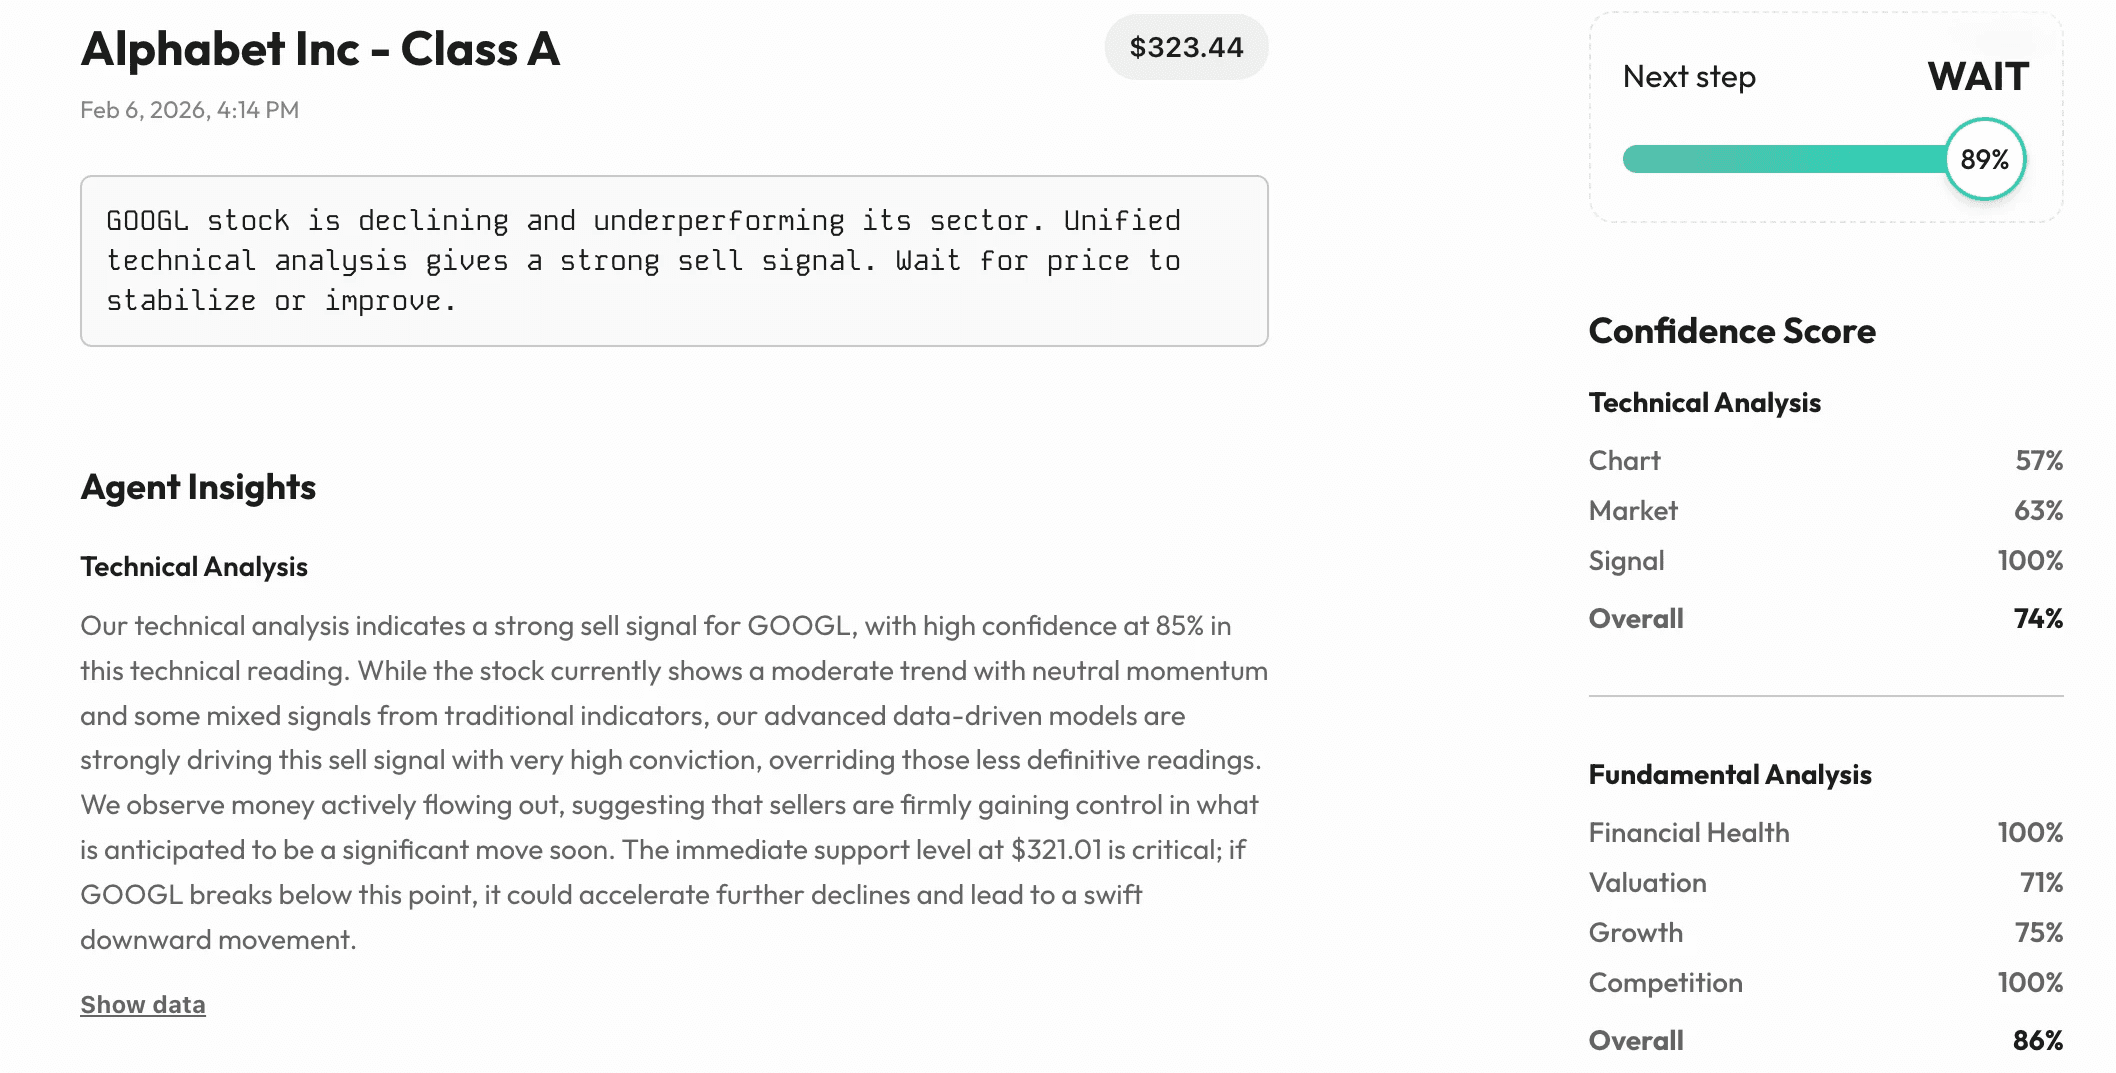
Imagine a large tech company whose stock is currently flashing:
Technicals: strong sell, breaking short-term support with heavy volume and underperforming its sector.
Fundamentals: low debt, strong cash reserves, leading market share in a growing industry, and solid long-term revenue and earnings growth.
News: negative coverage focusing on high AI or R&D spending and fears about margin compression, despite rising demand for its core services.
A short-term trader might see only the “strong sell” signals and falling price and decide to exit. A long-term investor, using the framework above, might conclude:
The business is still strong.
The balance sheet is healthy and supports continued investment.
The market is overreacting to near‑term spending that actually builds future competitive advantage.
That investor might mark it as a hold or even buy more at discounted prices, echoing Buffett’s point that “someone’s sitting in the shade today because someone planted a tree a long time ago.” AI‑driven tools like trade & tonic can surface these conflicting signals in one place, but this framework helps interpret them calmly.
5. How AI tools fit into stock analysis
Modern guides increasingly highlight how AI tools complement traditional stock analysis by scanning financials, news, and trends faster than humans. They can:
Aggregate fundamentals (growth, margins, debt, cash flows).
Score technicals (trend, support/resistance, volume patterns).
Quantify sentiment from headlines and social data.
But the core principle from Buffett, Graham, and Lynch still applies: tools provide data and structure, investors provide judgment and discipline. The edge for long-term investors is not reacting fastest—it’s staying rational when others are emotional.
6. How trade & tonic uses AI to Support That Shift
trade & tonic uses a 15+ multi‑agent AI architecture to turn any stock into a clear, explainable view. When you enter a ticker, several specialized agents work in parallel:
One focuses on fundamentals - revenues, margins, debt, cash flows.
Another looks at price behavior - trend, volatility, momentum.
Another monitors news and qualitative signals.
Others consider sector trends and macro context.
They each “vote” and explain their reasoning. The platform then produces:
A Buy / Hold / Sell decision.
A confidence score.
A short, plain‑language thesis summarising what drives that view.
The goal is not to tell you what to do. It is to give you a coherent starting point for your own judgment—something we explain in more depth in How to use trade & tonic to turn any stock into a clear Buy, Sell, or Hold decision.
For someone building a portfolio to support future income, this structure helps in three ways:
Clarity – You can see why a stock looks attractive or risky, not just that it does.
Consistency – Every stock is evaluated using the same framework, reducing emotional swings.
Learning – Over time, you can compare past decisions with outcomes and refine your own approach.
TL;DR
Benjamin Graham reminded investors that the goal is "safety of principal and an adequate return," not constant excitement. Buffett's and Lynch's philosophies reinforce the same core ideas: understand what you own, pay a fair price, and stay patient as long as the business remains strong.
The takeaway is simple:
Use fundamentals to decide what to own.
Use technicals and sentiment to decide how and when to build your position.
Use AI-driven platforms like ours to keep all the signals in one place—but always run them through a clear long-term framework before you hit buy, hold, or sell.
Long-term investing = Fundamentals > Technicals > News. Use the 7-point checklist: strong business + moat + fair valuation + ignore noise = BUY/HOLD. Trade & Tonic surfaces the data, you make the call.
______________
trade & tonic is an intelligent investment analysis platform built for thoughtful investors who want to understand why a stock moves, not just whether it will go up or down. It combines advanced AI models with time-tested investing principles to deliver transparent, easy-to-understand insights that replace noise with clarity.
Learn more
Discover more from the latest posts.